Dovewood Capital, LLC

'Making Finance Friendly - Linking Ability To Learning'  Start Today!

Innovation | Disruption | Transformation | Simplicity | Confidence | Courage | Success

  • Our Mission is to Close the Market Participation Gap where Everyone can comfortably & prudently participate in the Market experiencing all Capital Market & Economic benefits. 
  • Applying Innovative Data-Analytics to Simplify Complex Market Behaviors & Interpretations.
  • Facilitate Industry Disruption Resulting In Transformational Finance Initiatives. 
  • Accomplished through uniquely created content characterized by innovation, education, and relevant information only (no noise/bias) and communicated primarily through visualization mediums, resulting in simpler, broader & deeper experiences where understanding, comprehension & retention are actualized.
  • View Dashboard Key Performance Indicators.


A Note From Dovewood Capital. 

View Weekly S&P 500 vs Model 5-Day Returns Comparison

Trading in the stock market is always a very challenging & risky proposition. The odds are always stacked against you and everyone else participating.  Why you may be asking.  Well, in the simplest terms, the path of least resistance is always down, for example 1 to 2 is 100%, however 2 to 1 is 50% therefore the 50% fall is much easier to experience than a 100% rise.  Again, the path of least resistance.  So, that is always something that should be kept in mind, numbers moving the same distance, but where they start their move from and which direction typically favors the downside as the %’s are smaller, and therefore much easier to experience downside (in general).  

Having said this, it’s very important to choose stocks that do not exhibit those characteristics (or at least not too frequently) which is where our Model comes into play.  Utilizing the Model rankings as a guide can support you in your selection process as an educational & informational tool.  

Learn more today about our innovative Model and how it can potentially help you through the educational and informational content distributed on the basis of how it works to achieve our objectives of ‘Making Finance Friendly’. 

Scorecard

The all-new scorecard helps to easily track the performance of the Model vs. the S&P 500.

Stock Ticker

Market News

Market Screener

Major Averages - 2023 FY Results:
 

S&P 500 Historical (27-Year) Avg. Monthly Returns vs 2023 Actuals:
 

Market Conditions (Actual vs. Perceived Risk)

Transparency

View Current Real-Time Performance Difference 
(S&P 500 vs. Model)

Simplifying Stock Selection 

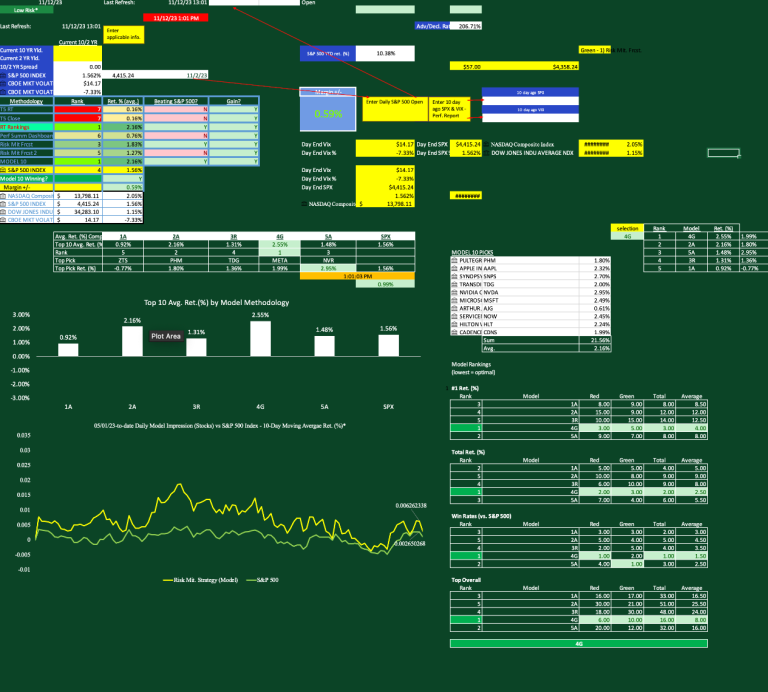
The Model Difference - 'A Clear Separation' - 57 Volatile Trading Days (8/28/23 -11/15/23)

Observations:

1) Over the cited period, the Model Outperformed the S&P 500 Index's Component Avg. Gain Rate by 1216 BPS or 12.16% on an absolute basis. (as of 11/15/23)

2) Over the cited period, the Model Outperformed the S&P 500 Index's Return 75.44% of the time (on average), whereas the S&P 500 Components have only Outperformed the S&P 500 Index 30.53% of the time (on average), resulting in a Favorable Model Outperformance Return Rate Difference of 4,494 BPS or 44.92% on an absolute basis. (as of 11/15/23)

Conclusions:  (So, big deal, what does this all mean?)

1) By employing the Model's Daily Top 10 selections vs a S&P 500 Index Fund, one could expect to beat (outgain) the S&P 500 Index by an increased % of the time (12.16% of the time on an absolute basis) and expect an overall gain 61.4% of the time (vs 49.2%), and 2) yield a higher avg. daily rate of return (currently 43 BPS or +0.43% on absolute basis terms); current overall return % is running at 26.75% vs 2.46% over 57 trading days. (as of 11/15/23)

Innovative Thinking (Strategy Development)

Daily S&P 500 Index (weighted vs net-weighted) Return vs Model Return (updated Weekly)

View in Virtual Real-Time during Market Hours.

All metrics updated as of 06.10.24 (107 Trading Days)

+0.26%

Weekly Index (Weighted) Return

+0.16%

Weekly Index (Net-Weighted) Return

+0.42%

Weekly Model Return

Key Performance Model Indicators vs. S&P 500 Index (Updated Weekly)

All KPIs reflecting data through the most recent market close.

Model Performance Measurement Period: 01/02/24-to-date (107 trading days)
Period Outperformance: +3853 BPS
Avg. Daily Outperformance: +36 BPS (Goal: +75 BPS); 
Model Outperformance: +38.52% (absolute basis)
Cumulative Win Rate: 68% (Goal: 85.0%); 

S&P 500 Component Updates
List of S&P 500 Companies Updated Quarterly (1st week following the end of each quarter).

Model Performance Returns vs S&P 500 (Updated Weekly)

Trading Days

107

Net Model Period Returns vs. S&P 500 Index Period Returns 

+38.53% 

Period Model Returns

+51.58%

Period S&P 500 Returns


+13.04%

Current Weekly Results

(as of current date)

Start Seeing Results Today!


Proprietary Model Component (Data Collection)

Highly developed & innovative age-driven data model inputs & metrics.

The interconnectedness of our proprietary model series provides proven daily results helping you to learn how to read markets, identify & recognize the state of specific equities & most importantly understand broad market risk identification, recognition, potential impacts & mitigation.

INNOVATION

DISRUPTION

TRANSFORMATION

SIMPLICITY

"

Heading

Heading

"

"

CONFIDENCE

COURAGE

SUCCESS

The Most Innovative, Educational & Comprehensive Ranking System Available.

tactically ranked & published daily.

Delivering a Daily Curated Compilation of the Entire S&P 500.

proprietary numeric sequencing methodology rigorously tested & proven ( > 10 years).

Eliminate Exhaustive Research Trying to Determine the Best Stocks for the Current Environment.

little to no experience required to understand, the model is built on an educational basis.

Our Mission is to Close the Market Participation Gap through the Delivery of Innovative Product Solutions & Services Thereby Creating Simplicity Out of Complexity. 

current (macro/micro) environment implicitly model-embedded resulting in impartial (no guesswork) gathering of stock behaviors each day as dynamics (economic/geo-political) change.

Mission & Vision

Dovewood Capital, LLC is a Finance Startup Company whose mission is to close the market participation gap by creating innovative solutions to complex market behaviors & interpretations, specifically risk anticipation, identification/recognition, impact/mitigation, and most importantly, illustrate/display all findings & conclusions in a manner in which all audiences can understand & benefit (educationally & informationally).

Kelly Horak has more than two decades of experience in various finance roles and industries, from mortgage banking and portfolio analytics, to business consulting and financial publishing. As the founder of Dovewood Capital LLC, he combines his passion and creativity for problem-solving, communicating, and leading with his expertise and skills in financial markets, operations and data analysis.

Dovewood Capital's vision is to Make Finance Friendly and empower people with economic knowledge and opportunities. The Company develops and publishes innovative models and reports that simplify the complexities of capital market behavior and provide engaging, educational, and informational content and services to their readers. 

The Company also manages and grows the business operations and partnerships, leveraging its deep experience and vast network in the finance industry to ultimately reimagine the future of finance and transform it into a more accessible, transparent and inclusive field. 

Kelly Horak's over 11 year's experience ( & over 26 total including mortgage banking; 15 years) working on financial equity markets/models have provided him with an in-depth knowledge, and specialization of the behavior of stocks under many market conditions. 

The relentless and rigorous Model data collection techniques, observations and strategies have evolved to a point of great reliability and conclusiveness, and therefore he created a wholly owned subsidiary of Dovewood Capital, LLC, to apply all of his learnings to a business-oriented financial website (www.stockimpression.com) that focuses on providing the model’s S&P 500 daily stock impressions (rankings). 

©2024 Copyright Dovewood Capital, LLC

*dba 'www.stockimpression.com', a wholly-owned subsidiary of Dovewood Capital, LLC. 

All rights reserved. V2.2

We need your consent to load the translations

We use a third-party service to translate the website content that may collect data about your activity. Please review the details in the privacy policy and accept the service to view the translations.